ServiceNow Operator Workspace

Scalable, service central and smart IT Network operation control system helping organizations to ensure the stability, health and availability of their business services through predictive intelligence.

 Overview 

Company – ServiceNow     |    Business unit – ITOM (IT Operation Management)    |    Product Event Management

Problem space 
Many industries are affected by service failures in colossal ways. When a critical service goes down, the consequences are painful. Event management enables customers to drastically minimize business service outages via seamlessly integrated Service and Alert consoles. The majority of our customers are mature enterprises, commercial, and small business. Industries include Airlines; health care Services; Financial institutes, retailers and many more. 

 “When a critical service goes down, the consequences are painful…”

Solution approach
Deliver a scalable, intuitive , AI empowered and actionable dashboard that monitors the health of business services. The dashboard provides powerful visualization, automation and user guidance helping IT staff monitors the network infrastructure in a NOC (Network operations center) and easily eliminate outages.

My Role – UX/UI lead

Team – UX Lead, Product manager, Dev team, Design system team, Workspace architecture team Analytics team 

Project size  – Large

My patent 

10,613,711 – Service management techniques

 MVP at a glance 

The NocPit provides visual, at-a-glance view of the network status and the key network KPI’s

Meaningful and actionable Service info is provided in the context of the service


Uses can manipulate and control the displayed data
 in many ways

Users can control the amount of data displayed , especially important when supporting large number of services 


 Challenge 

 The legacy system was outdated and limited in functionality.

Fails to deliver value at the
macro view 
Provides limited value
at the micro view
AIBeforeList-min
Missing contextual  data
& guidance

Key pain points 

The “swivel chair”…
such as “where is my data”? NOC Operators struggle to find what is most critical and complained that information about any service failure is hard to find.

Prioritizing the critical
Users complained that it is hard to identify critical issues fast enough.

Disjointed resolution
Triaging Alert is disjointed and time consuming – It is hard to find the relevant information for remediation.


Users complained that 
“It is hard to find what
is most
critical
& fix it fast enough…”


Logistical Challenges

Design limitations
For legal reasons we were prohibited from using any combination of size/color to represent a service due a patent infringement.

Team Location
Product and dev teams were internationally remote

Process
The process required acquiring separate sign off from many stakeholders

Design dependencies 
keeping the designs attune with ongoing changes from various design teams
 

TIME
Yup! tight deadlines…

Plan of Action 

 As the design lead I collaborated throughout the process with product,
dev & design teams to run design sprints and resolve issues. 

Discovery
Understanding  infrastructure, complexity & the problem 

Ideation
Identifying key steps,
user intent, tasks & opportunities for improvements 

  Journey map 
Gaining workflow clarity,
user empathy and deeper
view of the opportunities

Actions

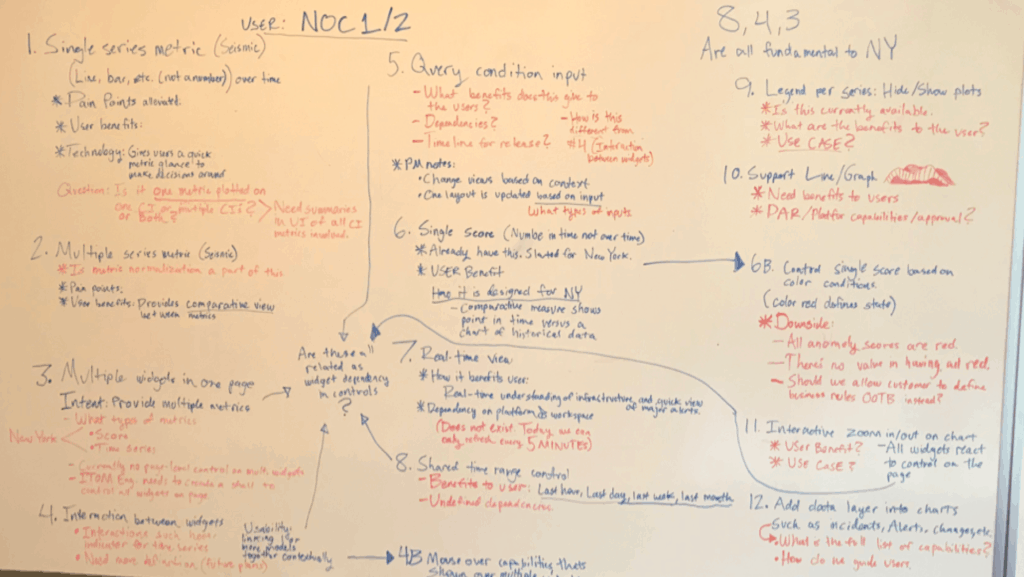
Research – I planned and conducted stakeholders interviews, user interviews, competitive analysis and validation testing plan

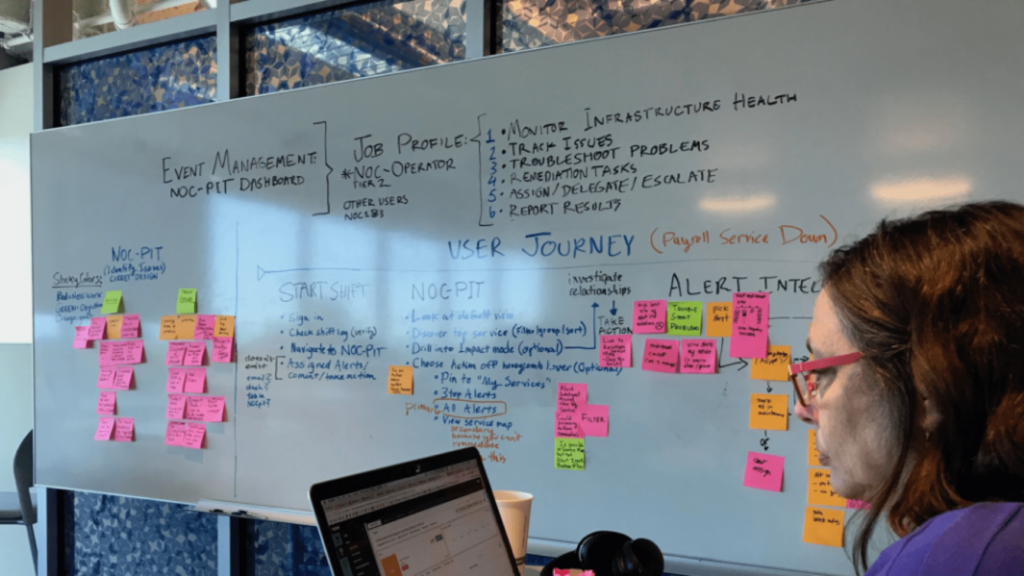
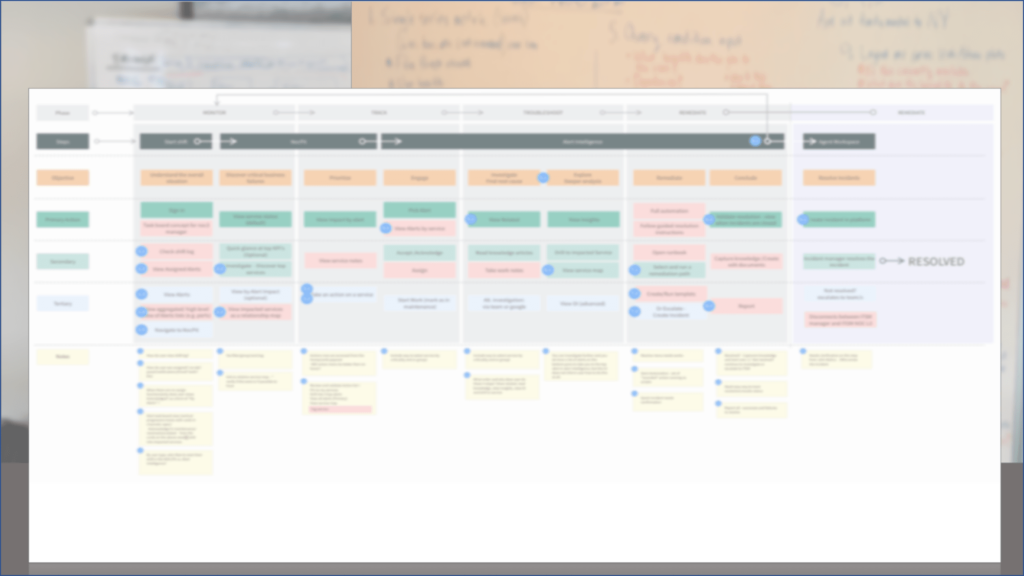
Discover – Using the collected data, in collaboration with my team, I created: user flows, experience map and the user Archetype/Persona

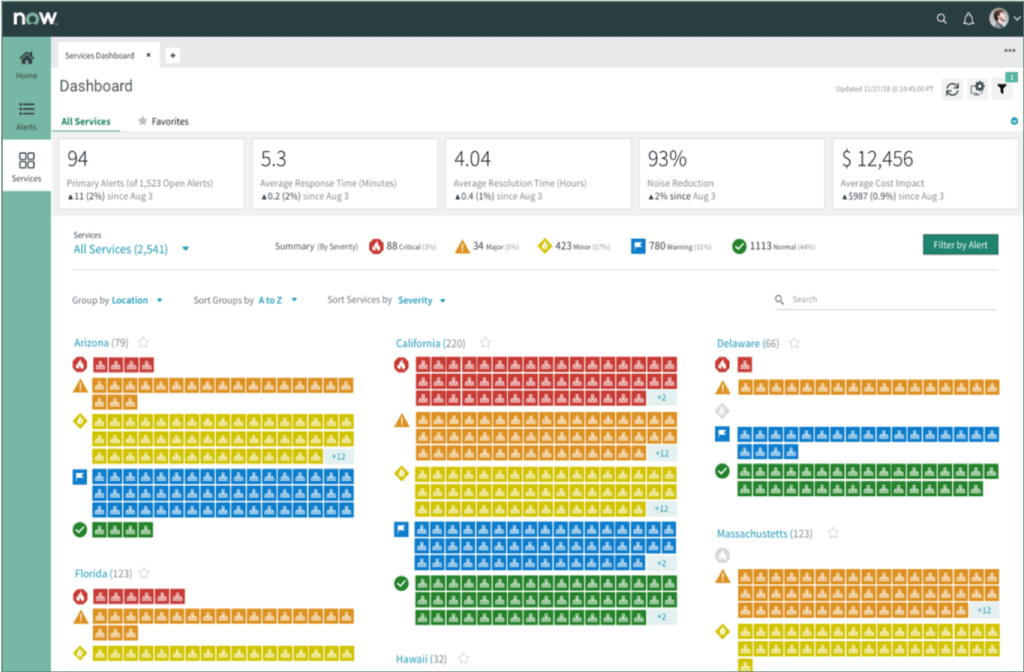
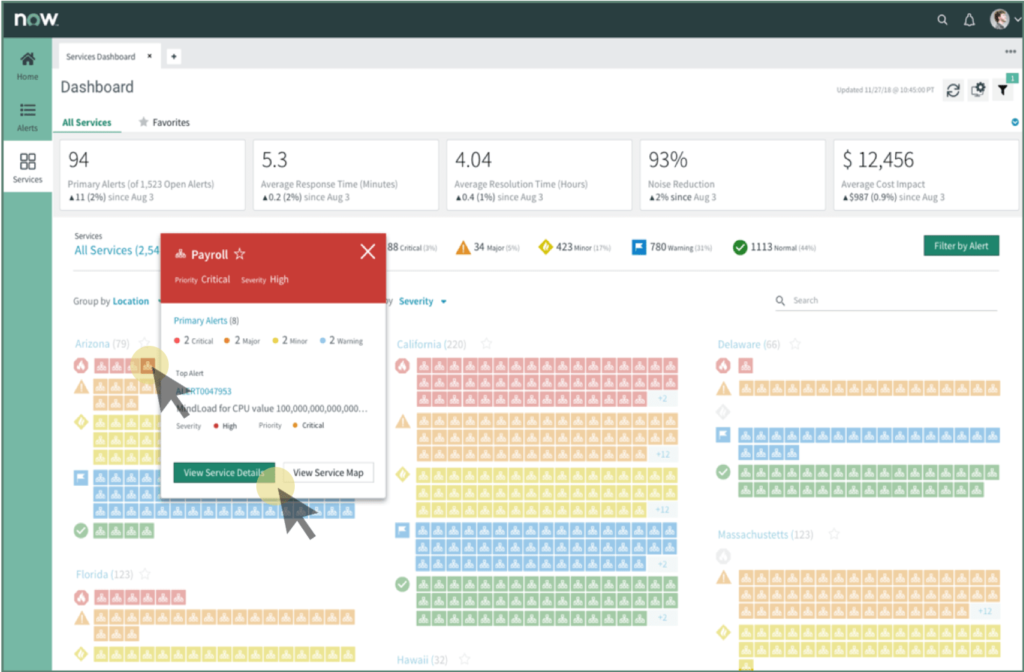
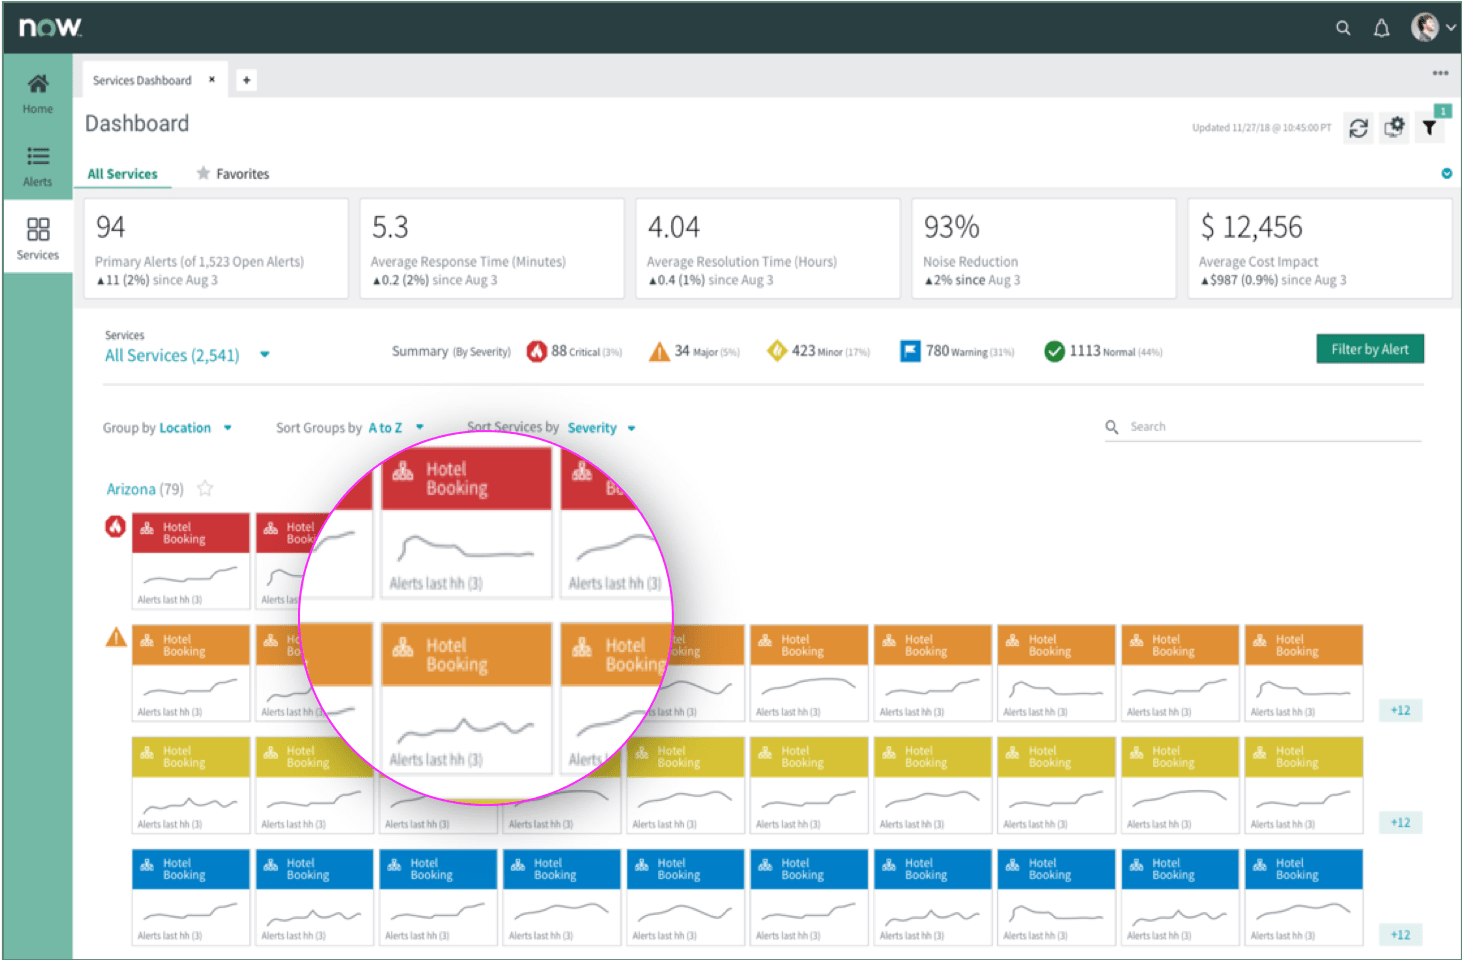
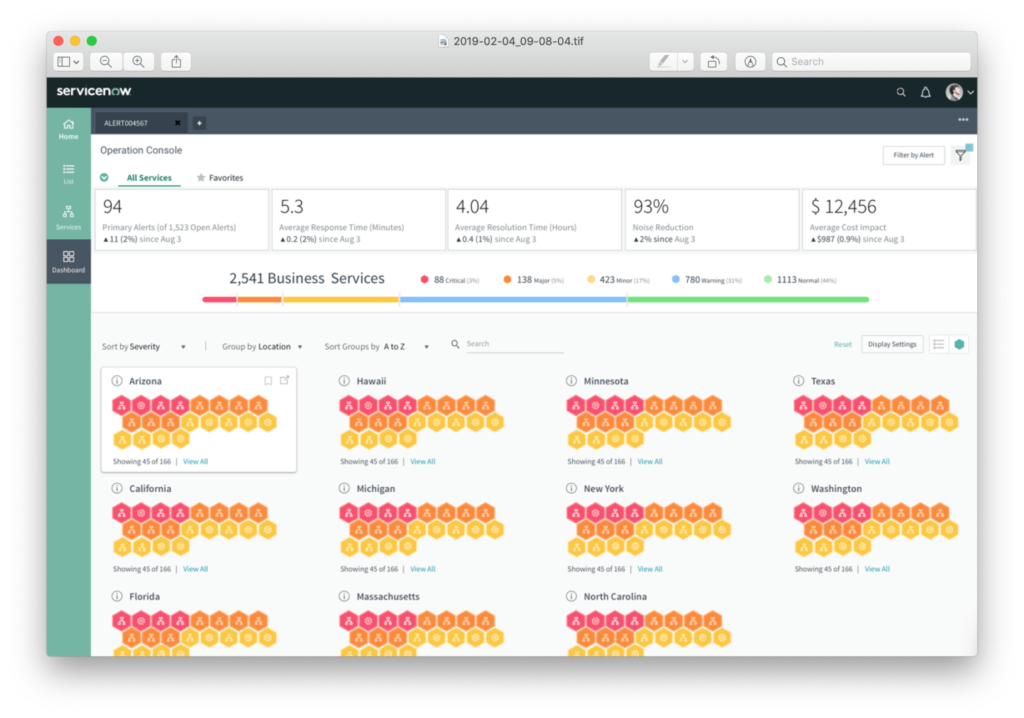
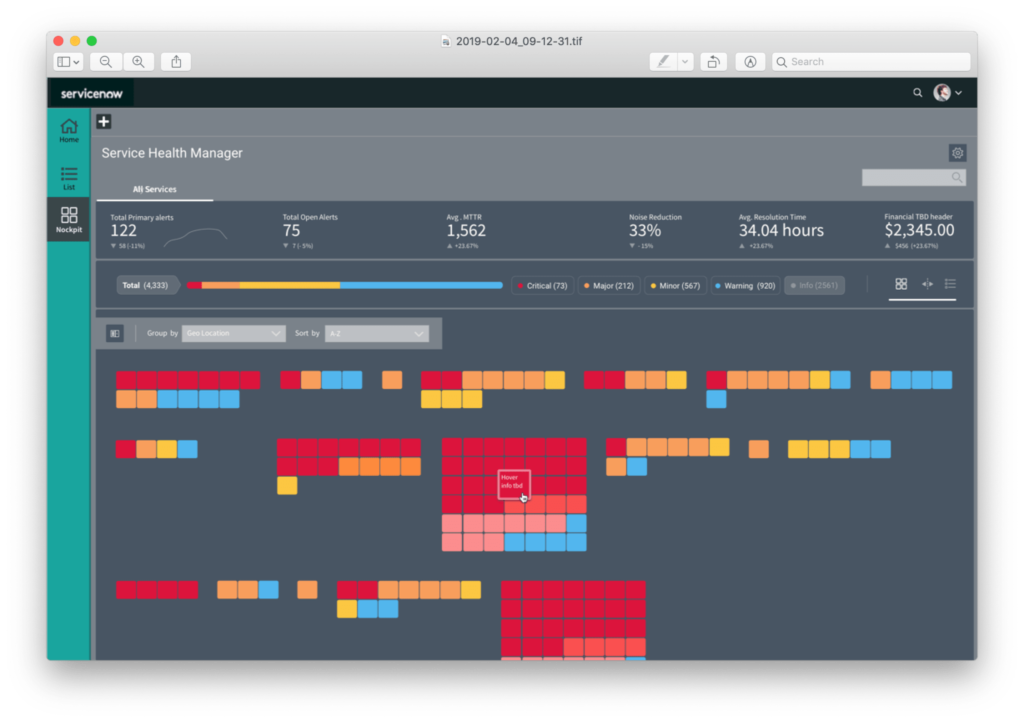
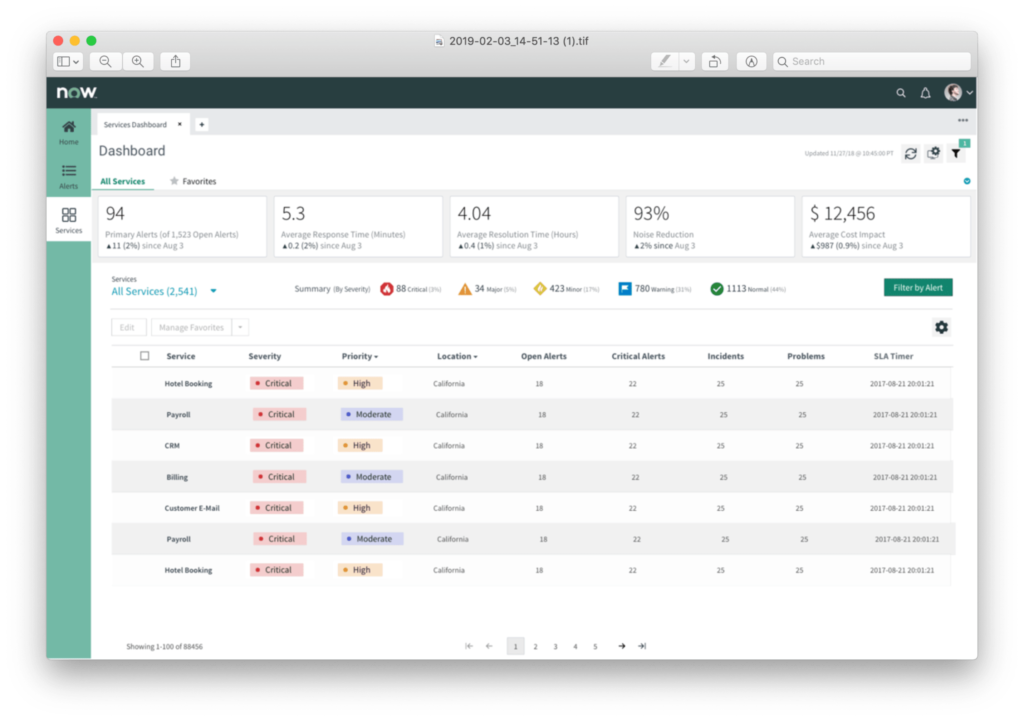
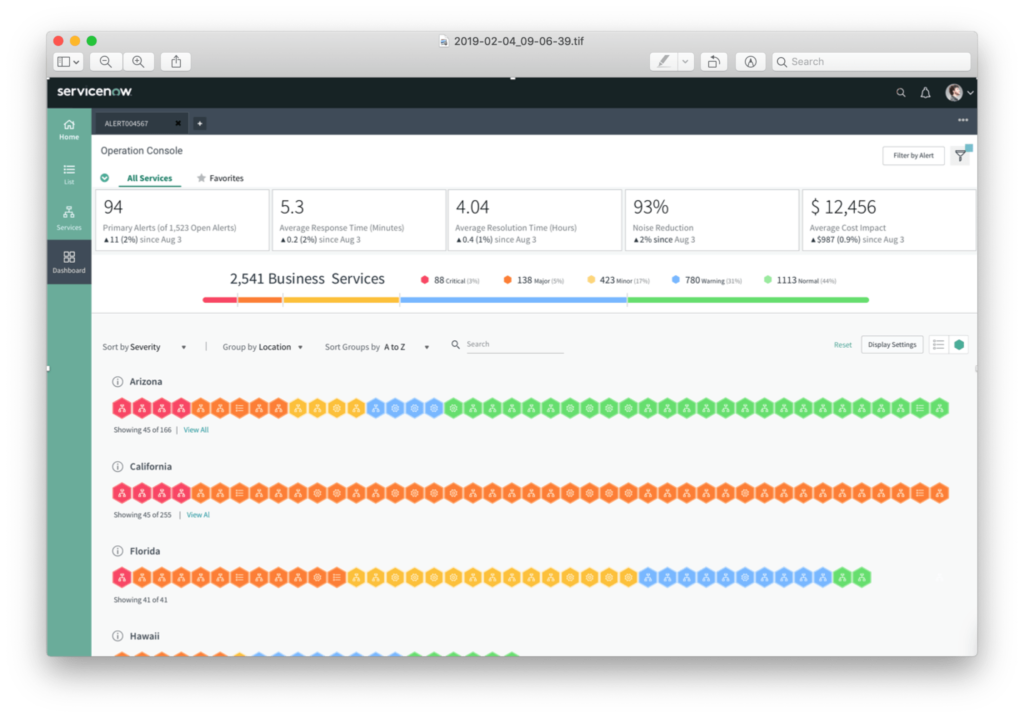
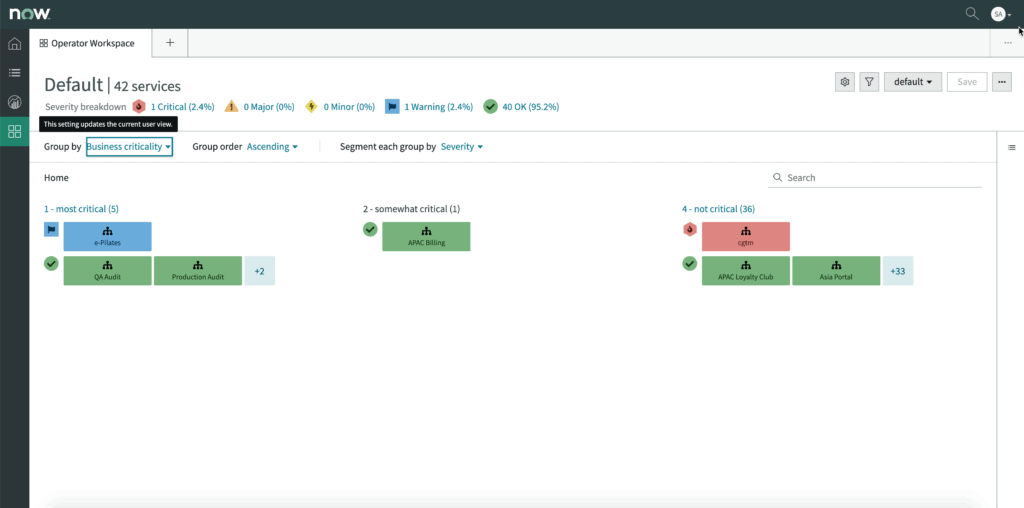
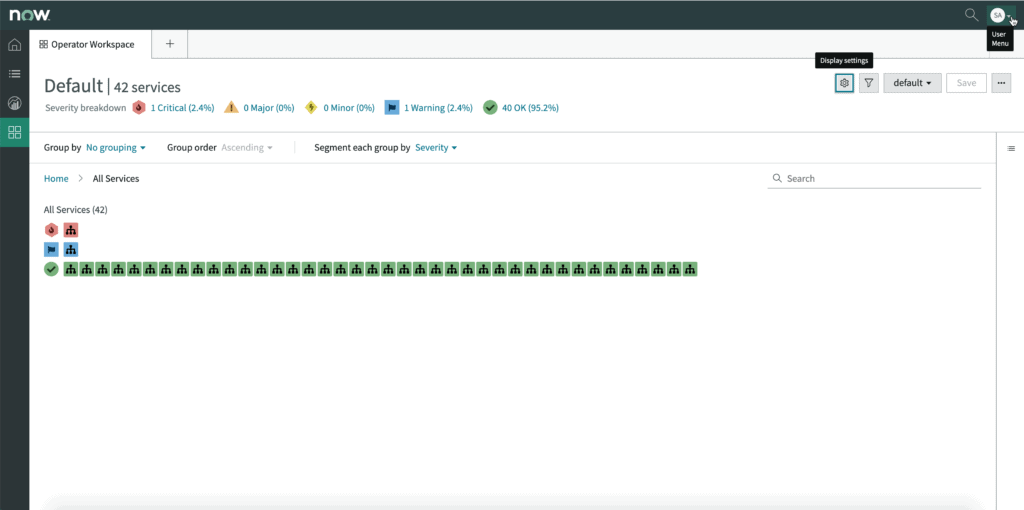
Design – First step was to define the layout and AI (LoFi wireframes) vet it with the new worskpace team, and validate our concept. Following that we moved into the “in depth” design phase, Which included more use cases, hi fidelity screens, prototyping and usability testing. Once we were “done” ( well.. done for the moment 😉 ) – I could apply the VX specification, hand them over to the dev team, and ensure they are implementing them to the dot.  

  • Steps and artifacts

  • Plan and conduct stakeholders & user interviews
  • Synthesize and share out interview data
  • Study the market to create a competitive review
  • Define the user archetype/persona
  • Map the user journey
  • Diagram the workflow
  • Design & prototype
  • Prepare for dev sprints
  • Conduct usability testing
  • Apply testing conclusions to the design

Examples of artifacts I created during the project

  Ready…Set…Design! 

Final Mockups

 From low to high fidelity – Tales from the canvas…  

Large tiles enables instant view into services

EM-min

Users have fingertip access to contextual data and remediation guidance

 Explorations 

Grouping and filtering
Going dark...mode
One way to address accessibility
Exploration with layout
Early wireframes

  Results 

 Operation workspace brings multiple teams together seamlessly to identify the root cause and resolve the issue without affecting customer productivity. With a clear visibility into issues, potentially even before the customer has even called or logged a ticket, Agents can identify flagged issues, then access detailed, real-time information in context collated from multiple sources to diagnose and resolve issues as quickly as possible. 

From Knowledge 2019 conference

Communication  – The new Dashboard provides complete yet at-a-glance view of the network status

Speed and clarity – Layout enables clear path of action and a way to quickly identify what is most critical 

Scale – Dashboard supports large number of services (7K+)

Context – Service view provides contextual and meaningful service info and actions

Flexibility – Users can filter, group, sort and view data in more granular density

Accessibility – Meeting WCAG standards providing accessibility for all